- Belgium ranks ninth easiest of 32 European countries to access, with over one in 20 (5.8%) non-EU residents becoming a citizen
- Estonia is the hardest country for men, based on the percentage of non-EU citizens acquiring citizenship, and Latvia ranks hardest for women
- Sweden is the easiest EU country to gain citizenship for both men and women
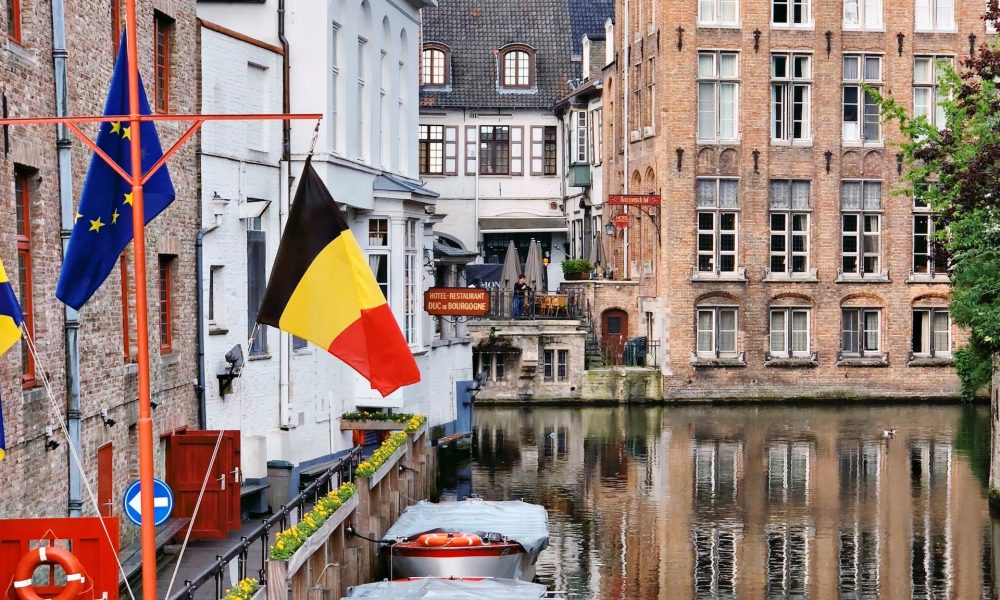
New research has revealed the hardest and easiest countries to gain citizenship, with Belgium being the ninth easiest in Europe.
The research by Canadian immigration agency CanadaCIS studied the latest Eurostat immigration data from 2009 to 2021 to see which countries have the highest and lowest percentages of non-EU residents becoming citizens.
10 easiest European countries to gain citizenship
The ten easiest countries to become a national are less clustered than the hardest countries, with four in Northern and Western Europe and one each in Southern and Southeast Europe. At least one in 20 (5%) non-EU residents become citizens yearly in each country.
Sweden is the easiest, with almost one in ten (9.3%) non-EU residents acquiring citizenship, over double the EU average. Sweden has the highest acceptance rates for both men and women compared to other countries. Women have an advantage with a 10.02% acceptance rate compared to 8.66% for men.
Norway, the Netherlands, Portugal, and Iceland are the second-to-fifth easiest countries to become citizens of, with acquisition rates above one in 25 (4%).
Most Northern European countries were the easiest to become nationals of, with Sweden, Norway, Iceland, and Finland having among the highest citizenship rates. Denmark is the only Northern country not included.
| 10 easiest European countries to gain citizenship | |||
| Rank | Country | Average % of non-EU residents who acquired citizenship | |
| 1 | Sweden | 9.3% | |
| 2 | Norway | 7.4% | |
| 3 | Netherlands | 7.1% | |
| 4 | Portugal | 6.6% | |
| 5 | Iceland | 6.5% | |
| 6 | Ireland | 6.5% | |
| 7 | Romania | 6.3% | |
| 8 | United Kingdom | 5.9% | |
| 9 | Belgium | 5.8% | |
| 10 | Finland | 5% | |
In Southern Europe, Portugal was the easiest; the Netherlands, Ireland, and the United Kingdom were the easiest Western states to become members of. The United Kingdom ranks eighth, with around three out of 50 (3.2%) residents granted citizenship.
Poland and Croatia are the easiest countries to change nationality in Central Europe, with rates of 4% and 3.9%, respectively.
North and West Europe are the easiest regions to change nationality, with a 5.9% acceptance rate compared to 1.9% in Central Europe and 3.6% in the South.
10 hardest European countries to get citizenship
The analysis revealed that the top nine most difficult countries to become nationals of are in Central Europe.
Estonia ranks as the hardest country for non-EU residents to become citizens of. It has the lowest average percentage of residents who gain citizenship, at around one in 200 (0.6%). Men are less likely to be accepted, with a lower acquisition rate of 0.58% compared to 0.69% for women.
Latvia, Czechia, and Lithuania are the next three hardest countries to become citizens of, with less than 1% of its non-EU residents gaining citizenship, compared to the European average of 3.56%.
The nations ranked fifth through ninth – Austria, Liechtenstein, Slovakia, Slovenia, and Germany – grant less than one in fifty (2%) non-EU residents citizenship.
Denmark is the hardest country outside Central Europe to get citizenship, with a 2% acquisition rate.
| 10 hardest European countries to become a citizen of | |||
| Rank | Country | Average % of non-EU residents who acquired citizenship | |
| 1 | Estonia | 0.6% | |
| 2 | Latvia | 0.7% | |
| 3 | Czechia | 0.73% | |
| 4 | Lithuania | 0.8% | |
| 5 | Austria | 1.2% | |
| 6 | Liechtenstein | 1.4% | |
| 7 | Slovakia | 1.5% | |
| 8 | Slovenia | 1.6% | |
| 9 | Germany | 1.8% | |
| 10 | Denmark | 2% | |
Over the last ten years, six in ten of the hardest countries granted a higher percentage of residents citizenship year-on-year, with Denmark’s rate increasing the fastest. Germany’s rate remained stable. Latvia, Lithuania, and Slovenia declined.
Countries with the largest gender gaps
Almost every European country gave citizenship to more women (3.85%) than men (3.56%), with only four in 32 accepting more men.
Bulgaria and Romania have the largest citizenship gender gaps in favor of men. In both countries, around 45% more men received national status than women.
Greece and Latvia’s acceptance rates were slightly skewed towards men, less than 10%.
In Europe, women have an easier time receiving national status than men.
Of the ten countries with the strongest preference for women, seven were in Central Europe, two in the North: Finland and Iceland, and Malta in the south.
The top three countries accepting more women are Slovenia, Lithuania, and Czechia, which granted three women national status for every two men.
Bryan Brooks, Immigration Expert from CanadaCIS, commented:
“As well as having some of the strongest passports, Europe has among the highest quality of life indicators, including high career prospects, living conditions, and healthcare.
Analysis reveals Central Europe is the most challenging region to get citizenship, with Northern and Western Europe the easiest.
In nearly nine in ten countries, the naturalization rate was higher for women. It could be that women are more eligible, likely to emigrate, or commonly carry the required skills to fill shortages.”
The research was conducted by the Canadian immigration agency CanadaCIS.
ENDS
Full data:
| Easiest European countries to become a citizen of (Easiest to hardest) | ||
| Rank | Country | Average % of non-EU residents who acquired citizenship (2009-2021) |
| 1 | Sweden | 9.3% |
| 2 | Norway | 7.4% |
| 3 | Netherlands | 7.1% |
| 4 | Portugal | 6.6% |
| 5 | Iceland | 6.5% |
| 6 | Ireland | 6.5% |
| 7 | Romania | 6.3% |
| 8 | United Kingdom | 5.9% |
| 9 | Belgium | 5.8% |
| 10 | Finland | 5.0% |
| 11 | Spain | 4.2% |
| 12 | Poland | 4.0% |
| 13 | Croatia | 3.9% |
| 14 | France | 3.5% |
| 15 | Malta | 3.5% |
| 16 | Cyprus | 3.1% |
| 17 | Italy | 3.1% |
| 18 | Luxembourg | 3.0% |
| 19 | Greece | 2.9% |
| 20 | Switzerland | 2.8% |
| 21 | Hungary | 2.3% |
| 22 | Bulgaria | 2.2% |
| 23 | Denmark | 2.0% |
| 24 | Germany | 1.8% |
| 25 | Slovenia | 1.6% |
| 26 | Slovakia | 1.5% |
| 27 | Liechtenstein | 1.4% |
| 28 | Austria | 1.2% |
| 29 | Lithuania | 0.8% |
| 30 | Czechia | 0.7% |
| 31 | Latvia | 0.7% |
| 32 | Estonia | 0.6% |
Source: Eurostat: Residents who acquired citizenship as a share of resident non-citizens by former citizenship and sex (2012-2021) https://www.canadacis.org/
Photo by Despina Galani on Unsplash
Share this article:


